WHAT IS POWER BI?
Microsoft Power BI is a set of software services, applications, and connections that work together to transform disparate data sources into logical, visually engaging, and interactive insights. Whether your data is in the form of a simple Microsoft Excel worksheet or a combination of cloud-based and on-premises hybrid data warehouses, Power BI makes it simple to connect to your data sources, visualise (or discover) what matters, and share it with anyone you want.
PARTS OF POWER BI:
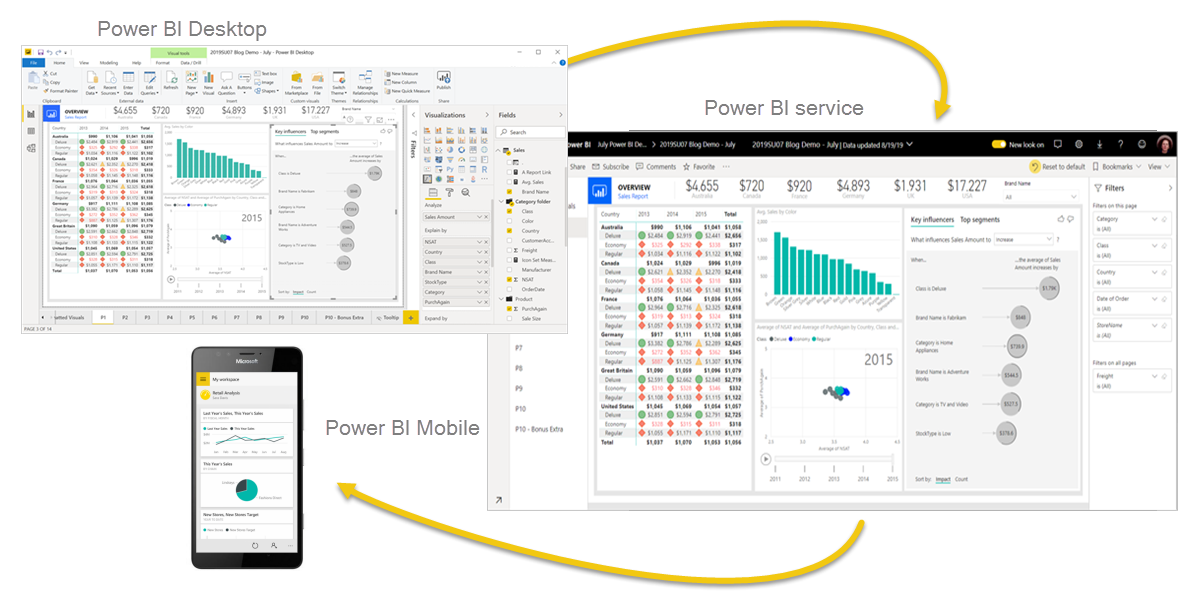
Power BI consists of 3 parts :
1. Power BI desktop : It is a Microsoft windows desktop application.
2. Power BI service : It is an online SaaS service.
3. Mobile Power BI apps
COMMON FLOW OF POWER BI:
1. Create a report using Power BI Desktop and the data you've imported.
2. Publish to the Power BI service, where you may construct dashboards and generate new visualizations.
3. Share dashboards with others, particularly those who are constantly on the move.
4. In Power BI Mobile applications, you can see and interact with shared dashboards and reports.
2. Publish to the Power BI service, where you may construct dashboards and generate new visualizations.
3. Share dashboards with others, particularly those who are constantly on the move.
4. In Power BI Mobile applications, you can see and interact with shared dashboards and reports.
BUILDING BLOCKS OF POWER BI:
1. Visualizations:
A visualization (sometimes called a visual) is a visual representation of data, such as a chart, a color-coded map, or other intriguing things you may make to visually represent your data. There are a variety of visualization kinds available in Power BI, and more are being added all the time. Visualizations can be basic, such as a single number representing something noteworthy, or aesthetically sophisticated, such as a gradient-colored map depicting voter emotion on a certain social problem or concern. A visual's objective is to show data in a way that gives context and insights, which would be impossible to identify from a simple table of numbers or text.

2.Datasets :
A dataset is a collection of data used by Power BI to generate visuals. A basic dataset based on a single table from a Microsoft Excel worksheet, such as the one seen in the accompanying image, can be created. Datasets may also be a collection of data from a variety of sources that you can filter and combine to create a unique set of data (a dataset) for Power BI.

3. Reports:
A report in Power BI is a grouping of visualizations that display on one or more pages. A report in Power BI is a collection of items that are connected to each other, much like any other report you may generate for a sales presentation or write for a school assignment. The picture below depicts a Power BI Desktop report—in this example, the second page of a five-page report. The Power BI service also allows you to produce reports.
4. Dashboards:
You construct a dashboard when you're ready to distribute a report or a group of visualizations. A Power BI dashboard is a collection of graphics from a single page that you can share with others, similar to the dashboard of a car. Frequently, it's a small set of graphics that provide you rapid insight into the facts or message you're attempting to convey.
A dashboard must fit on a single page, which is sometimes referred to as a canvas (the canvas is the blank backdrop in Power BI Desktop or the service, where you put visualizations).
A dashboard must fit on a single page, which is sometimes referred to as a canvas (the canvas is the blank backdrop in Power BI Desktop or the service, where you put visualizations).
5. Tiles:
A tile is a single visualization on a dashboard in Power BI. It's the rectangular box that houses a single image. One tile is seen in the accompanying image, which is surrounded by other tiles.


No comments:
Post a Comment